Main Screen
The Main Screen is your central hub for monitoring weather conditions, tracking pressure changes, and logging symptoms. Here's a comprehensive guide to each section.
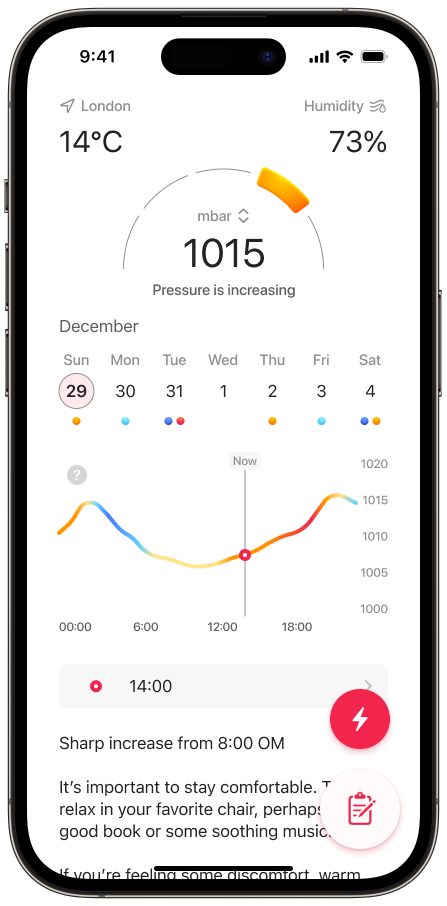
Current Weather
This section shows the weather for your location, taken from the hourly forecast rather than from a live weather station:
- Your location (on iPhone, tap the city name to open My Locations and follow another city)
- Current temperature
- Humidity levels
The chart and the forecast refresh every time you open the app. The temperature and humidity are the values for the hour the app is showing, so they can differ a little from a thermometer outside.
Pressure Gauge Indicator
The prominent central gauge displays the current barometric pressure in your chosen unit.
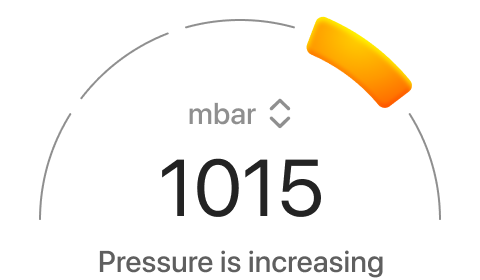
The gauge provides visual indicators to help you understand pressure trends. It shows the pressure in relation to the previous hour.
We compare the pressure reading from the current hour with the reading from the previous hour.
- Pressure is steady if the difference is under 0.3 mbar.
- Pressure is increasing if it has gone up by 0.3 mbar or more.
- Pressure is rapidly increasing if it has gone up by 0.6 mbar or more (0.8 mbar on Android).
- Pressure is decreasing if it has gone down by 0.3 mbar or more.
- Pressure is rapidly decreasing if it has gone down by 0.6 mbar or more (0.8 mbar on Android).
The gauge is about the current hour only, so it can read steady on a day whose summary talks about a sharp change a few hours away. On Android you can drag along the chart to see the reading for another hour; it returns to now on its own.
The gauge has five positions and colour coding that helps identify pressure stability. Tap the pressure number to change the unit.
Week View Navigation
The week view lets you move between days. Tap a day to show its chart. Swipe to move to the previous or next week. On the free plan only today and tomorrow are open; past days and the rest of the week ahead need a paid plan.
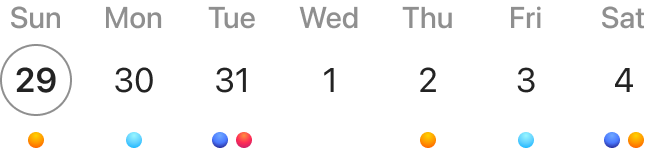
The selected day is marked with a grey circle. Under each day there can be a dot that tells you about the pressure at a glance. On iPhone you choose the style under Settings > Days Indication:
- Color dots: a red dot means a rapid rise that day, a blue dot means a rapid drop. A day can have both.
- Alarm dots (default): a dashed dot means the day has a pressure swing big enough to trigger your alert settings, so symptoms are possible. Alarm dots only appear for today and future days.
On Android a dot appears under a day when it contains a change bigger than your alert sensitivity. The dot is filled if you logged symptoms that day.
Pressure Forecast Chart
The interactive pressure chart displays detailed pressure variations throughout the day:
- Bottom axis shows the hours. The chart can show 1, 2 or 3 days at once; pick this under Settings > Chart Timeframe (the default is 2 days).
- Right axis displays pressure values in your chosen unit. The scale adapts to what is on screen, so a calm day is zoomed in and a stormy day is zoomed out. Compare the colours, not the height of the line, when judging how strong a change is. With the timeframe set to 2 or 3 days, the days shown together share one scale and can be compared directly.
- Each hour is coloured by how much the pressure changes compared with the hour before:
- Red means a rapid rise
- Orange means a moderate rise
- Yellow means the pressure is steady
- Light blue means a moderate drop
- Blue means a rapid drop
"Moderate" starts at 0.3 mbar per hour and "rapid" at 0.6 mbar per hour on iPhone (0.8 on Android). Rapid changes are the ones that most often set off symptoms.
Attacks for the Day
This section lists everything you logged on the selected day:
- Time, intensity and symptoms of each entry
- Tap an entry to see the details, edit it or delete it
- Entries also appear as marks on the chart, so you can see what the pressure was doing when it happened
Daily Summary
A short text under the chart describing the whole day you have selected, not just the current hour. That is why it can mention a sharp drop while the gauge says the pressure is steady right now.
1. General pressure trend
On Android the summary opens with one line for the day as a whole: the pressure will remain stable, fluctuate, increase or decrease. This line is not shown in the iPhone app at the moment.
For example: "The pressure will increase throughout the day."
2. Rapid pressure changes
The hours with the sharpest changes appear on separate lines. Consecutive hours with the same kind of change are grouped into one line.
For example: "Rapid increase from 3:00 PM to 4:00 PM" or "Rapid decrease at 6:00 PM"
3. Advice for the day
A short paragraph on how to pace the day. It is picked from the shape of the forecast: sharp rises, sharp drops, both, mild movement in one direction, mild movement both ways, or no real change. It is the same text for everyone with that kind of day, so it does not take your logged symptoms into account.
A day with both a sharp rise and a sharp drop in it gets the strongest wording, "highly unstable" on iPhone and "fluctuating extremely" on Android. One hour of each is enough for that, so in changeable weather you will see it often. The alerts are the more selective guide, because they only fire above the sensitivity you choose.
Community Tips (iPhone)
Below the daily summary the iPhone app shows one tip written by another Pressure Pal user. It is picked to suit the selected day: a tip marked for rising pressure on a rising day, for falling pressure on a falling day, or one marked for any weather. Tips that mention symptoms you have logged are preferred. It is not shown on days that are locked on the free version.
Tips come from other users and are not medical advice. Each one is reviewed by us before anyone else sees it.
On any tip you can:
- tap the heart to like it (the most liked tips make the Top 10)
- tap the translate button to read it in your own language
- report it, which hides it from you and sends it to us for review
To read more tips or share your own, tap Community Tips in the menu at the bottom of the main screen. The screen has three tabs: New, Top 10 and My Tips. Tap Add Tip, choose Relief, Prevention or Lifestyle, write the tip, and optionally pick the pressure conditions and symptoms it helps with. Other users see the town you shared it from, never your exact location. Your tip appears under My Tips straight away and for everyone else once it has been reviewed.
The Community Tips list cannot be filtered by rising, falling or steady pressure. Those conditions can be added when writing a tip and are used when choosing the tip on the main screen.
There is no setting to hide the tip card at the moment, and a tip cannot be edited or deleted in the app. If you want one of your tips changed or removed, send us a message through Ask a Question. The Android app does not have Community Tips.
Attacks Tracking
Two buttons at the bottom of the screen:
- Quick Log (red lightning button): one tap logs a symptom for the current hour, each further tap raises the intensity
- Journal (white button): time, intensity, symptoms and notes
For more information about tracking options, see our Symptom Journaling Guide.
Menu Options
The menu is a list of rows at the bottom of the main screen. Scroll down past the chart to reach it.
- Community Tips (iPhone): read tips from other users and share your own. See Community Tips above.
- Share Today's Forecast: Share a snapshot of today's forecast as an image with friends and family.
- All Recorded Data: Access your complete history of recorded attacks and symptoms.
- Export Report: Generate a PDF or CSV report of your recorded attacks, with the pressure at each one.
- Settings: Customize app preferences and configurations. See our Settings Guide for detailed information.
- Rate us: leave a rating, or send us feedback if something is not right.
- Ask a Question: opens a short form that goes straight to our support inbox. Leave your email if you want a reply. You can also email us at hello@pressurepal.app.